
Designing for Operational Clarity
Company
Brightside Health
Role
Senior Product Designer
About the Project
As the senior designer on two internal tools at Brightside, I partnered closely with the Member Care and Operations teams to improve internal workflows that directly impacted patient care. While leading the redesign of the Admin Case Dashboard, I also took the initiative to map the Declined-to-Treat (DTT) workflow after several Care Ops team members described it as painful and tedious. Running both efforts in parallel helped me uncover deeper system-wide pain points and feed those insights directly into the dashboard redesign.
This case study combines two interconnected projects:
Admin Case Dashboard redesign - Streamlining how Operations and Clinical teams access key patient information in a single, actionable view.
Declined-to-Treat (DTT) workflow mapping - Tracing the end-to-end process to surface UX gaps and inefficiencies affecting multiple teams.
Both initiatives addressed fragmented workflows, communication breakdowns, and tool inefficiencies, ultimately improving the speed and quality of care for Brightside members.
My Role
I led the end-to-end design of key flows in the admin tool by conducting the following:
Discovery / Research
Defining strategy and journey-mapping
Facilitated stakeholder workshops
Wireframes / Low + High Fidelity
The Team

The Problem
Brightside’s internal tools were not designed to support the complexity of real world clinical and operations workflows. As a result, care teams struggled with inefficiencies, communication gaps, and fragmented systems, ultimately affecting the quality and speed of patient support.
Scattered Info: Critical data was spread across tools, requiring constant switching.
No Messaging: Admins couldn’t send or track messages in-platform.
Manual Workflows: DTT cases involved unclear steps and follow-ups.
No Task Visibility: RX and Therapy tasks weren’t linked, causing confusion.
Cluttered UI: Dense layouts made it hard to prioritize and act quickly.
Admin Case Dashboard
Designs (Low Fidelity)
While conducting discovery for the Case Dashboard, I consistently heard frustration from the care team about the Declined-to-Treat (DTT) workflows.The below image is an example of the internal workflow after a clinician submits a case consultation to clinical leadership for a DTT decision. The case is then reviewed in clinical rounds to confirm the patient’s status in other programs, then surfaces on the admin dashboard as a task for followup.

I wanted to get a precise understanding of the user journey by tracking every screen interaction and documenting live walkthroughs with the Member Care team. The image below gives an idea of the cumbersome task of the care team navigating back and forth between multiple portals to handle DTT cases.

Key Painpoints:
Admins waste time switching between admin and provider portals to check notes and send messages
Critical actions gets missed because there is no way to message directly from admin view
There is duplicate work and confusion if patient is a part of multiple programs because the needed info is not visible
The layout is overwhelming resulting in tasks being hard to track and prioritized
With this information in mind, my next steps were:
Map the current journey and document systemic UX gaps
Facilitate a cross-functional workshop to align on goals, business touchpoints, and pain points
Research and Discovery
Below is the original Case Details page for a Brightside member.
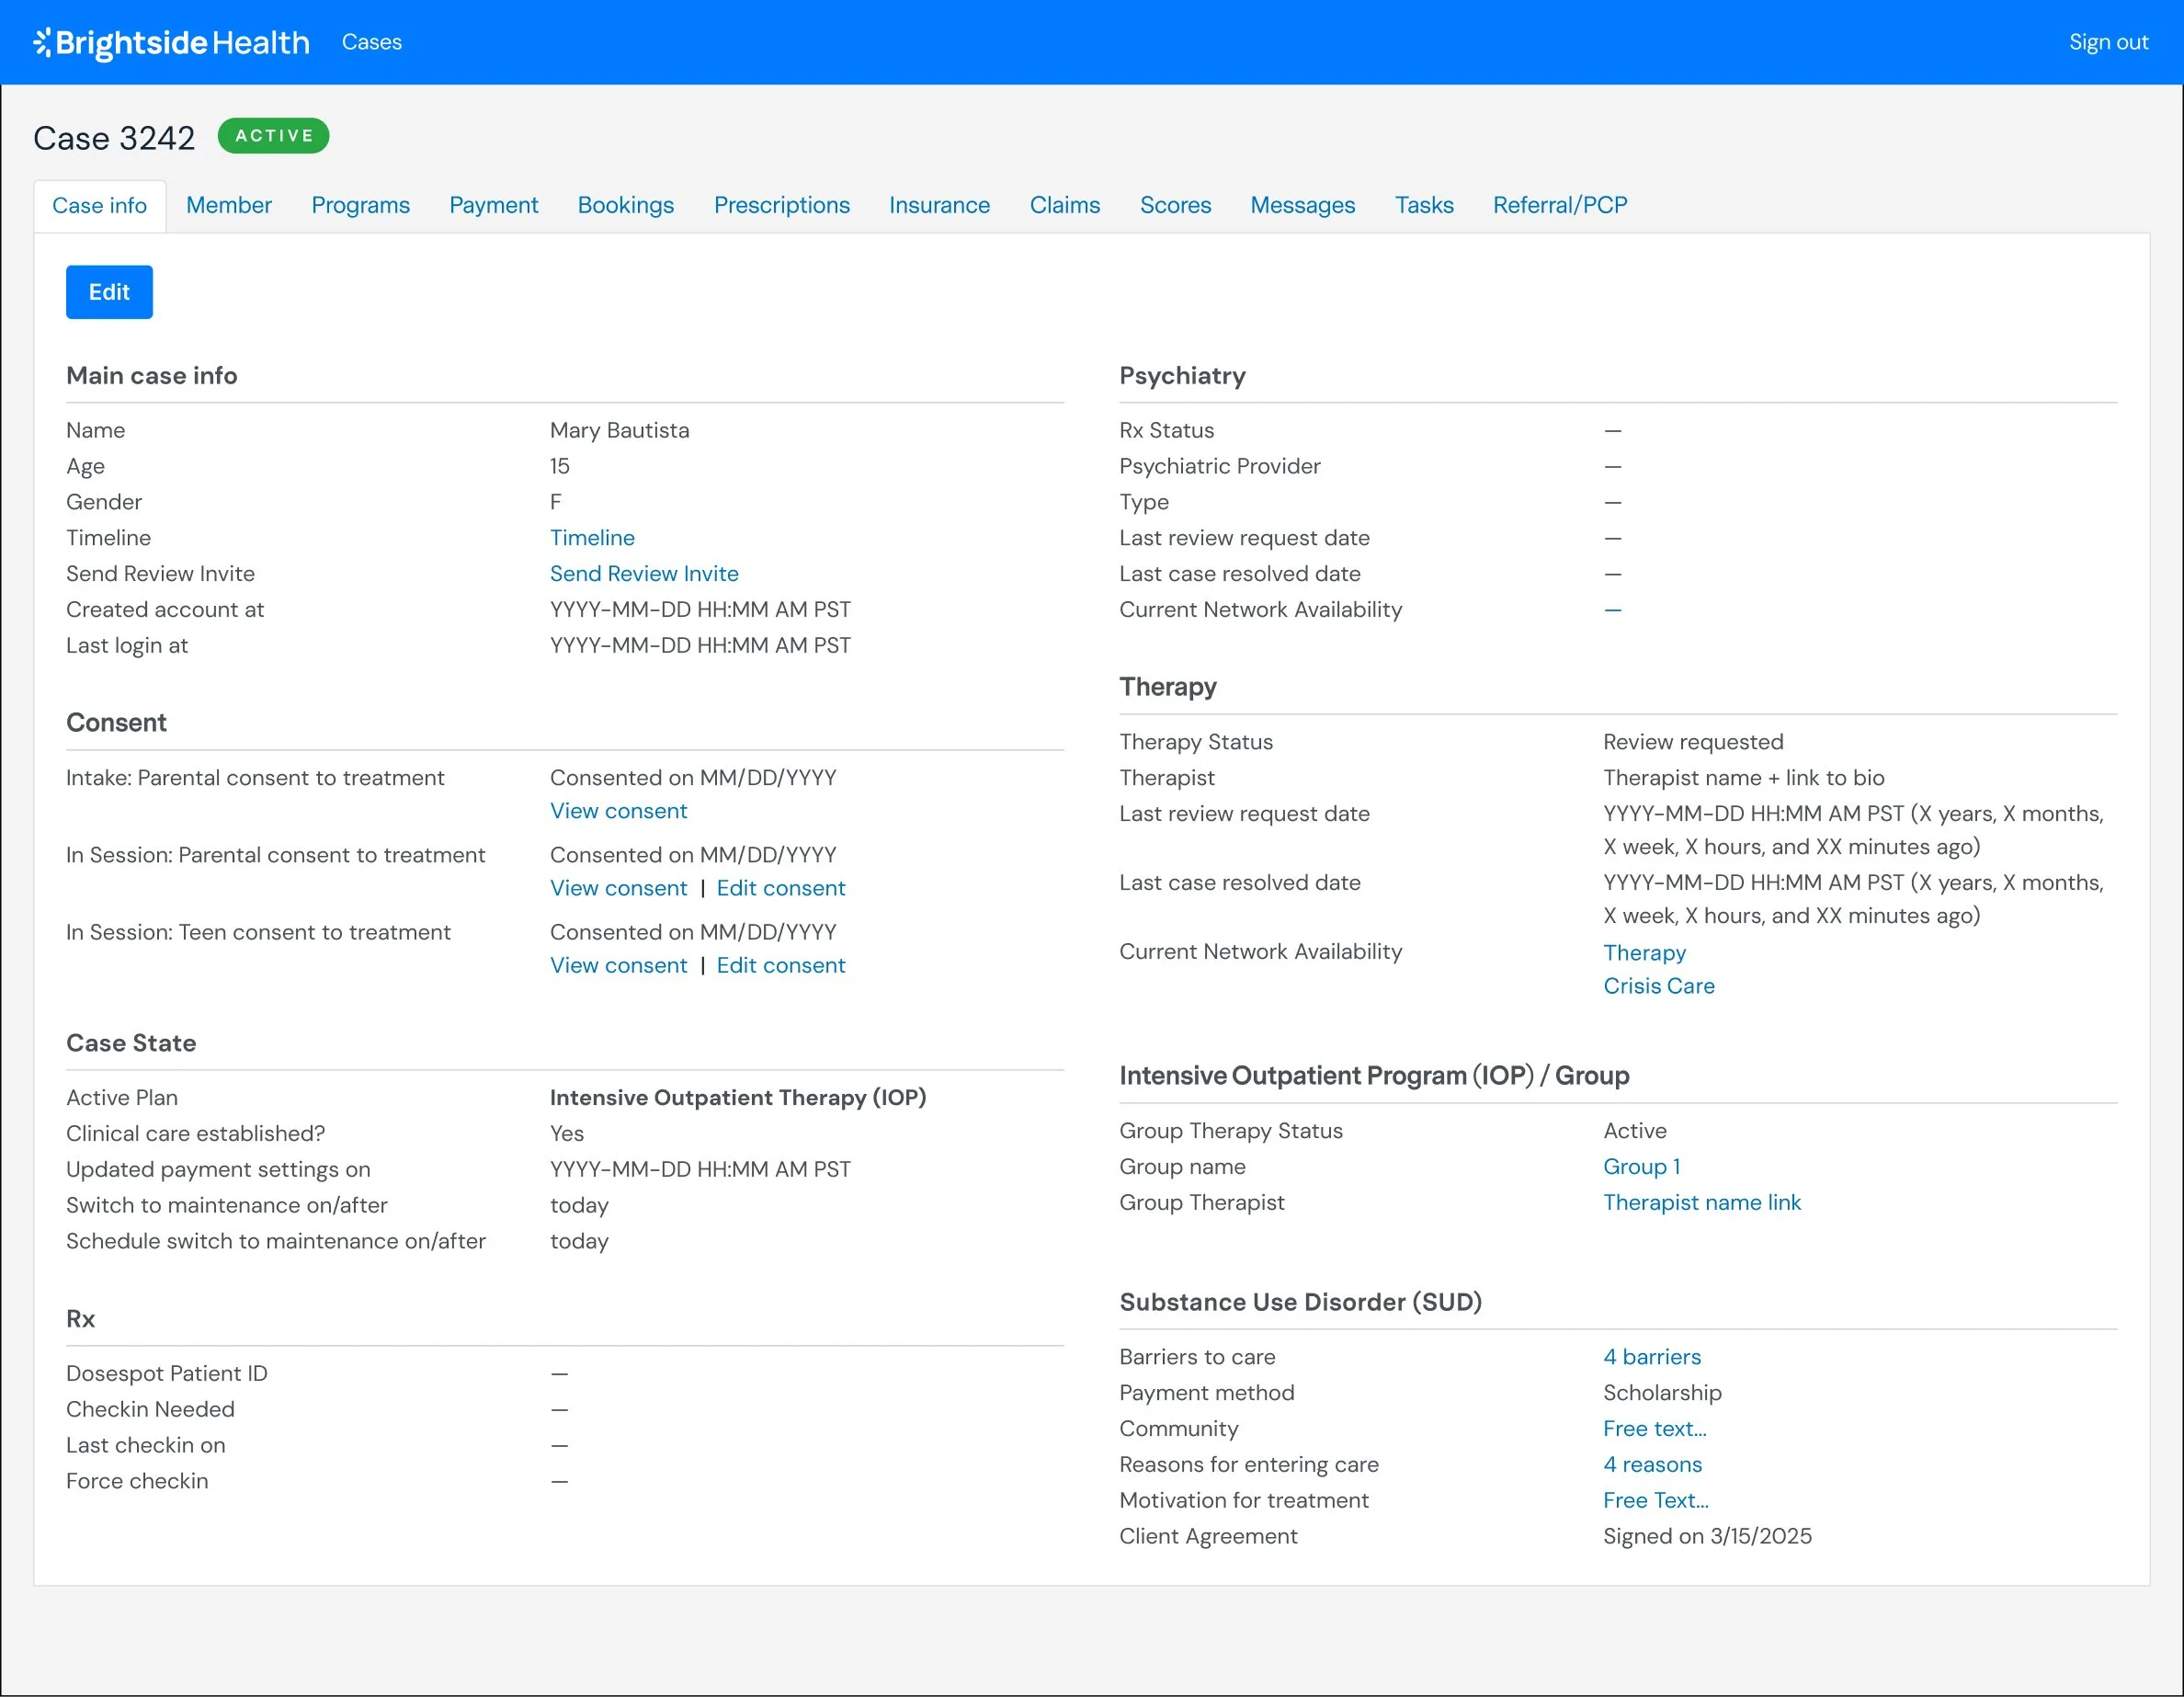
Key Pain points:
With information spread across multiple tabs and systems, operations teams struggled to quickly understand a patient’s case.
This lead to delays, inefficiencies, and gaps in care.
Workshop with the CareOps Team
I facilitated a workshop with the CareOps team to identify the most important information they wanted surfaced in the Case Dashboard. We also conducted a prioritization exercise, which helped inform the information hierarchy and layout of the design.


Competitive Analysis and Dashboard UI Research
I conducted a competitive analysis by reviewing dashboards to evaluate their information architecture, navigation flows, data visualization techniques, and overall UX/interactivity. This research provided valuable insights into effective layout structures and best practices for organizing complex data in an intuitive way.

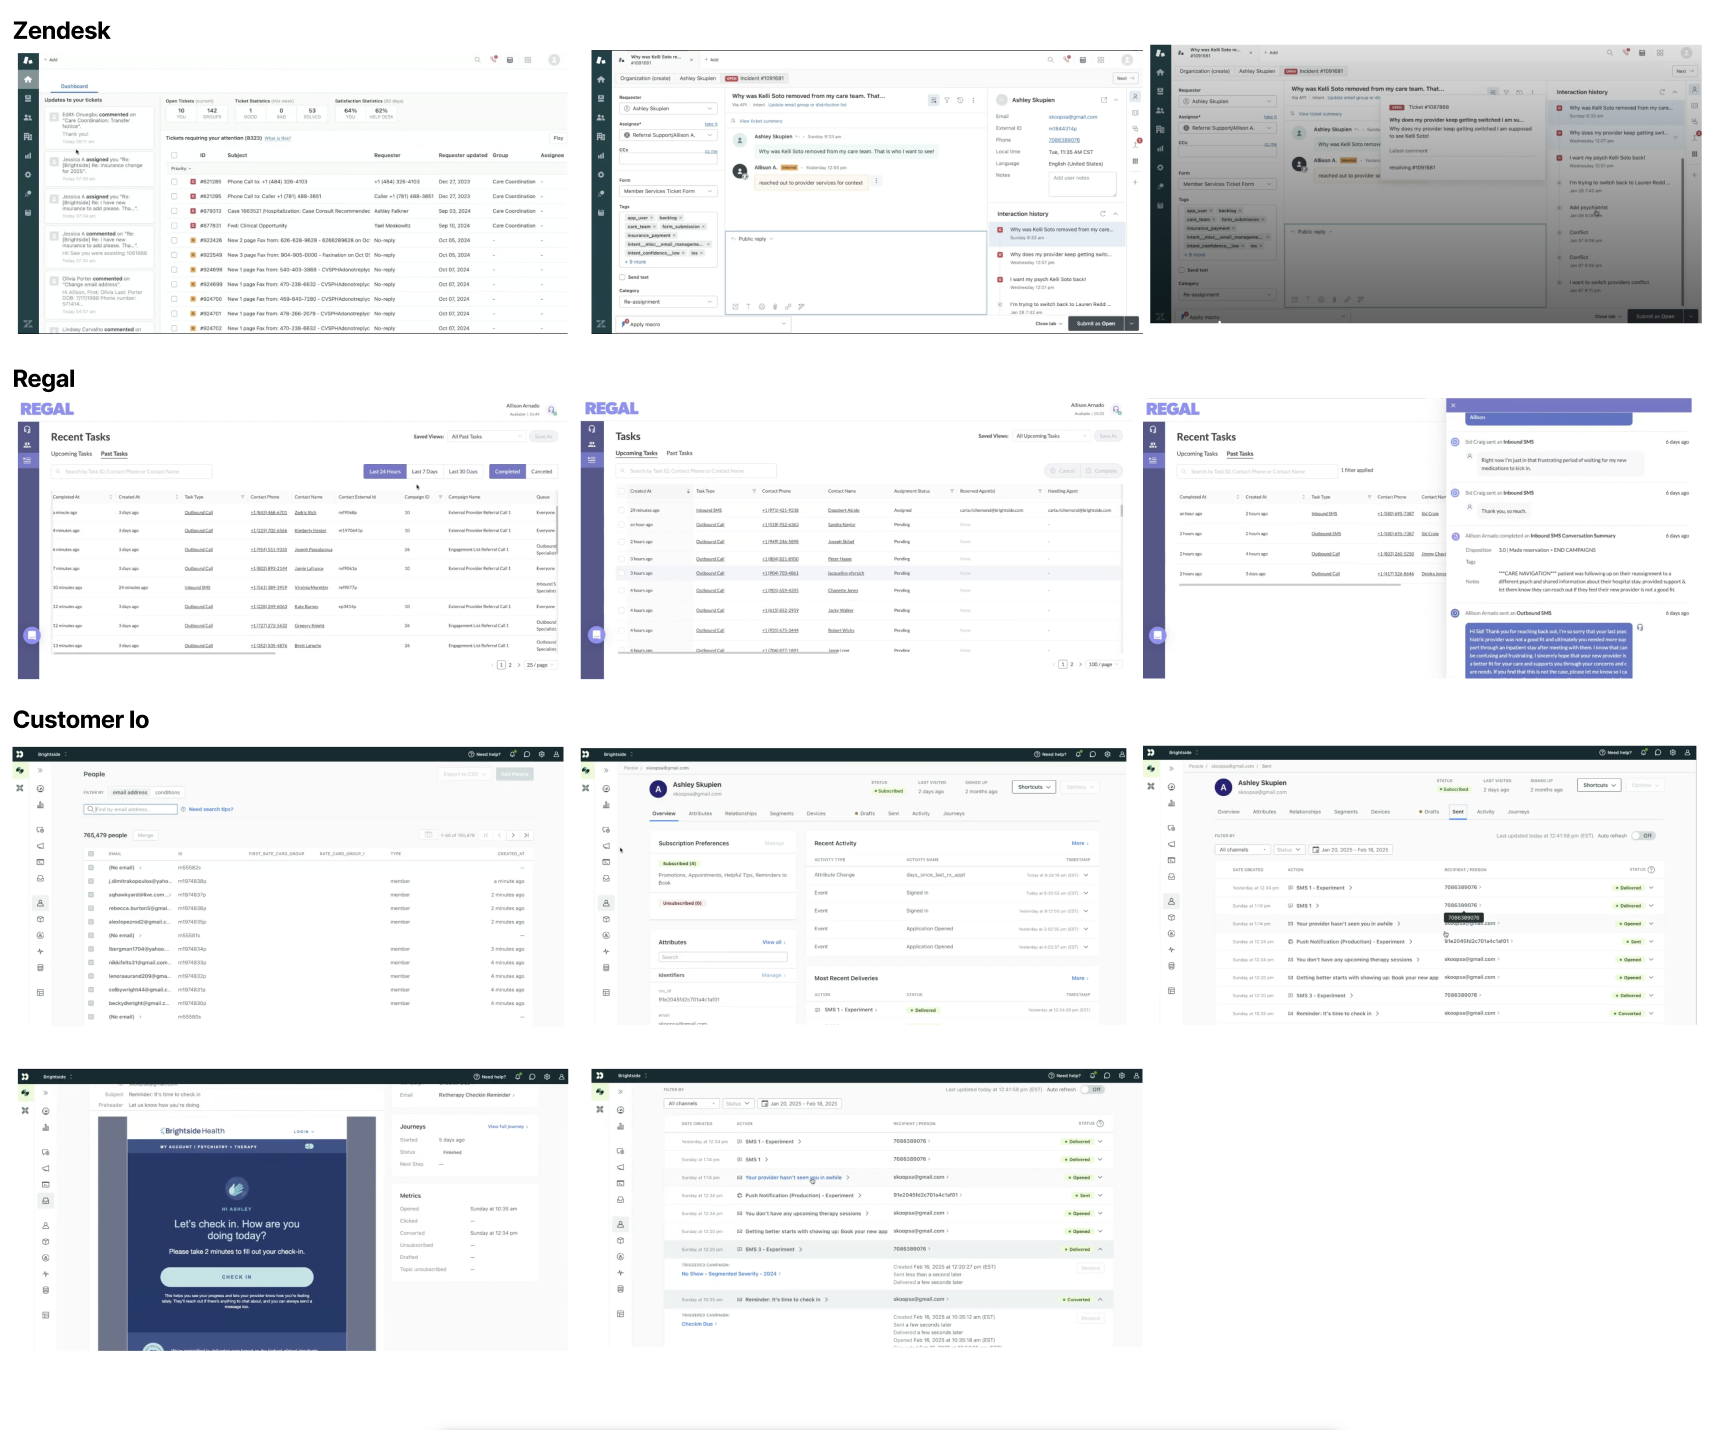
3rd-Party Tools
The CareOps team emphasized the need to display third-party API information on the dashboard. To ensure an accurate and user-friendly representation, I shadowed a member care specialist to observe their workflow when integrating external messaging tools such as Regal, Customer.io, and Zendesk. I used these insights to inform the dashboard’s design.
Declined to Treat Workflows
Based on research into the CareOps team's key information needs, insights from dashboard design patterns, and third-party integration requirements, I developed multiple design concepts. Through iterative collaboration with stakeholders, I:
Worked closely with the PM and CareOps team to gather feedback, refine acceptance criteria, and define user stories
Engaged in ongoing technical discussions with engineering to assess feasibility and address edge cases
Evolved the designs through this cross-functional alignment process

Designs (High Fidelity)
Below is the final design ready for handoff. Key improvements made were:
Streamlined navigation - Direct access to information links eliminates tab digging
Action-oriented data display - Surfaces critical decision-making information prominently
Intuitive information hierarchy - Clear tiered structure with drill-down capability
Integrated third-party status - Real-time app status visibility reduces site switching

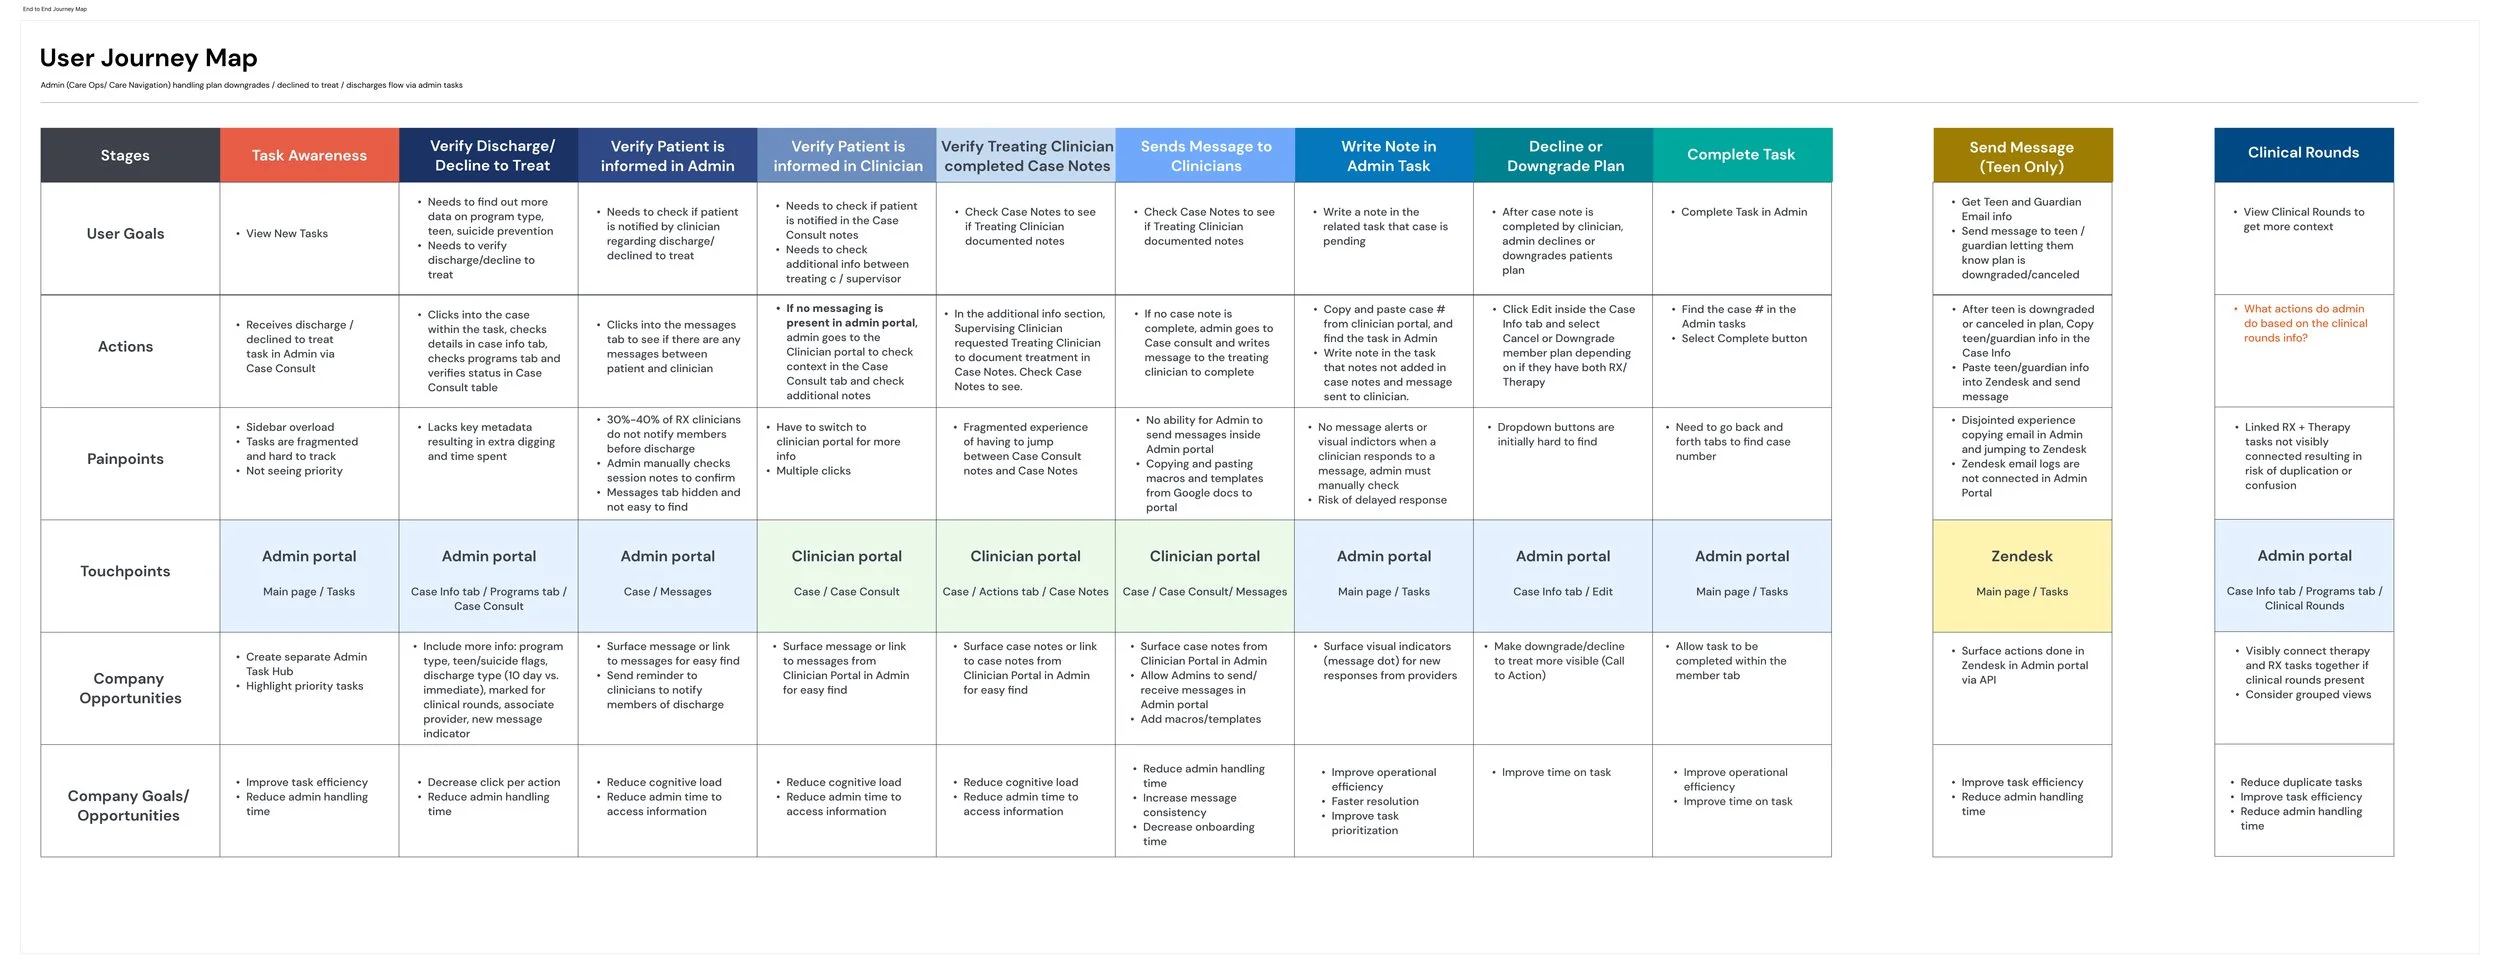
User Journey Map
To understand the holistic overview of the journey and get shared alignment withe the team, I faciliated a working session with the PM and CareOps team to map the existing user journey. This visualization helped us identify pain points, opportunities, and ensure alignment between user needs and business objectives.
Impact
Impact
The redesigned Case Dashboard provided a clearer, more centralized view of member information after release. leading to faster decision-making, fewer missed steps, and reduced cognitive load for Ops and Clinical teams.
14–20% reduction in case resolution time
Time savings of 5–10 minutes per case (based on team feedback), translating to hours saved daily across around 200 cases
Fewer missed messages and duplicate tasks due to improved task visibility and inline communication
Improved confidence in handling complex care scenarios with clearer, more actionable insights
The DTT journey mapping aligned stakeholders across clinical and operations, uncovered key UX gaps, and served as a strategic foundation for both design and product planning. What began as a self-initiated research effort became a key artifact for future roadmap priorities and design initiatives.
Served as a starting point for design, highlighting where workflows broke down and what needed to be surfaced in the new dashboard
Informed roadmap planning, helping Product and Ops teams prioritize the most critical pain points across systems
Brought visibility to communication gaps, task ambiguity, and siloed workflows between admin and clinicians
Drove alignment across Member Care, Clinical Leadership, and Product teams on shared challenges and opportunities
My Learnings
Working on these projects in parallel reinforced the power of self-initiated work to influence high-priority initiatives and reveal broader system gaps. I learned the importance of designing from real workflows, not just interfaces.
Key Takeaways:
Designing across systems reveals the real user pain
Mapping full workflows uncovered how siloed tools created friction, and helped connect the dots across teams and responsibilities.
Internal tools need just as much UX love
These tools aren’t public-facing, but they power critical decisions. Investing in their usability drives real business impact behind the scenes.
Self-initiated work can drive meaningful impact
The DTT journey map, though not originally part of the roadmap, helped shape a prioritized initiative (Case Dashboard) and gave stakeholders a much needed high-level view of the broader ecosystem.